Monitor
In this tutorial, we introduce the DeepSpeed Monitor and provide examples of its usage.
Overview
Monitoring model and system metrics during training is vital to ensure hardware resources are fully utilized. The DeepSpeed Monitor enables live logging of metrics through one or more monitoring backends such as PyTorch’s TensorBoard, WandB, Comet and simple CSV files.
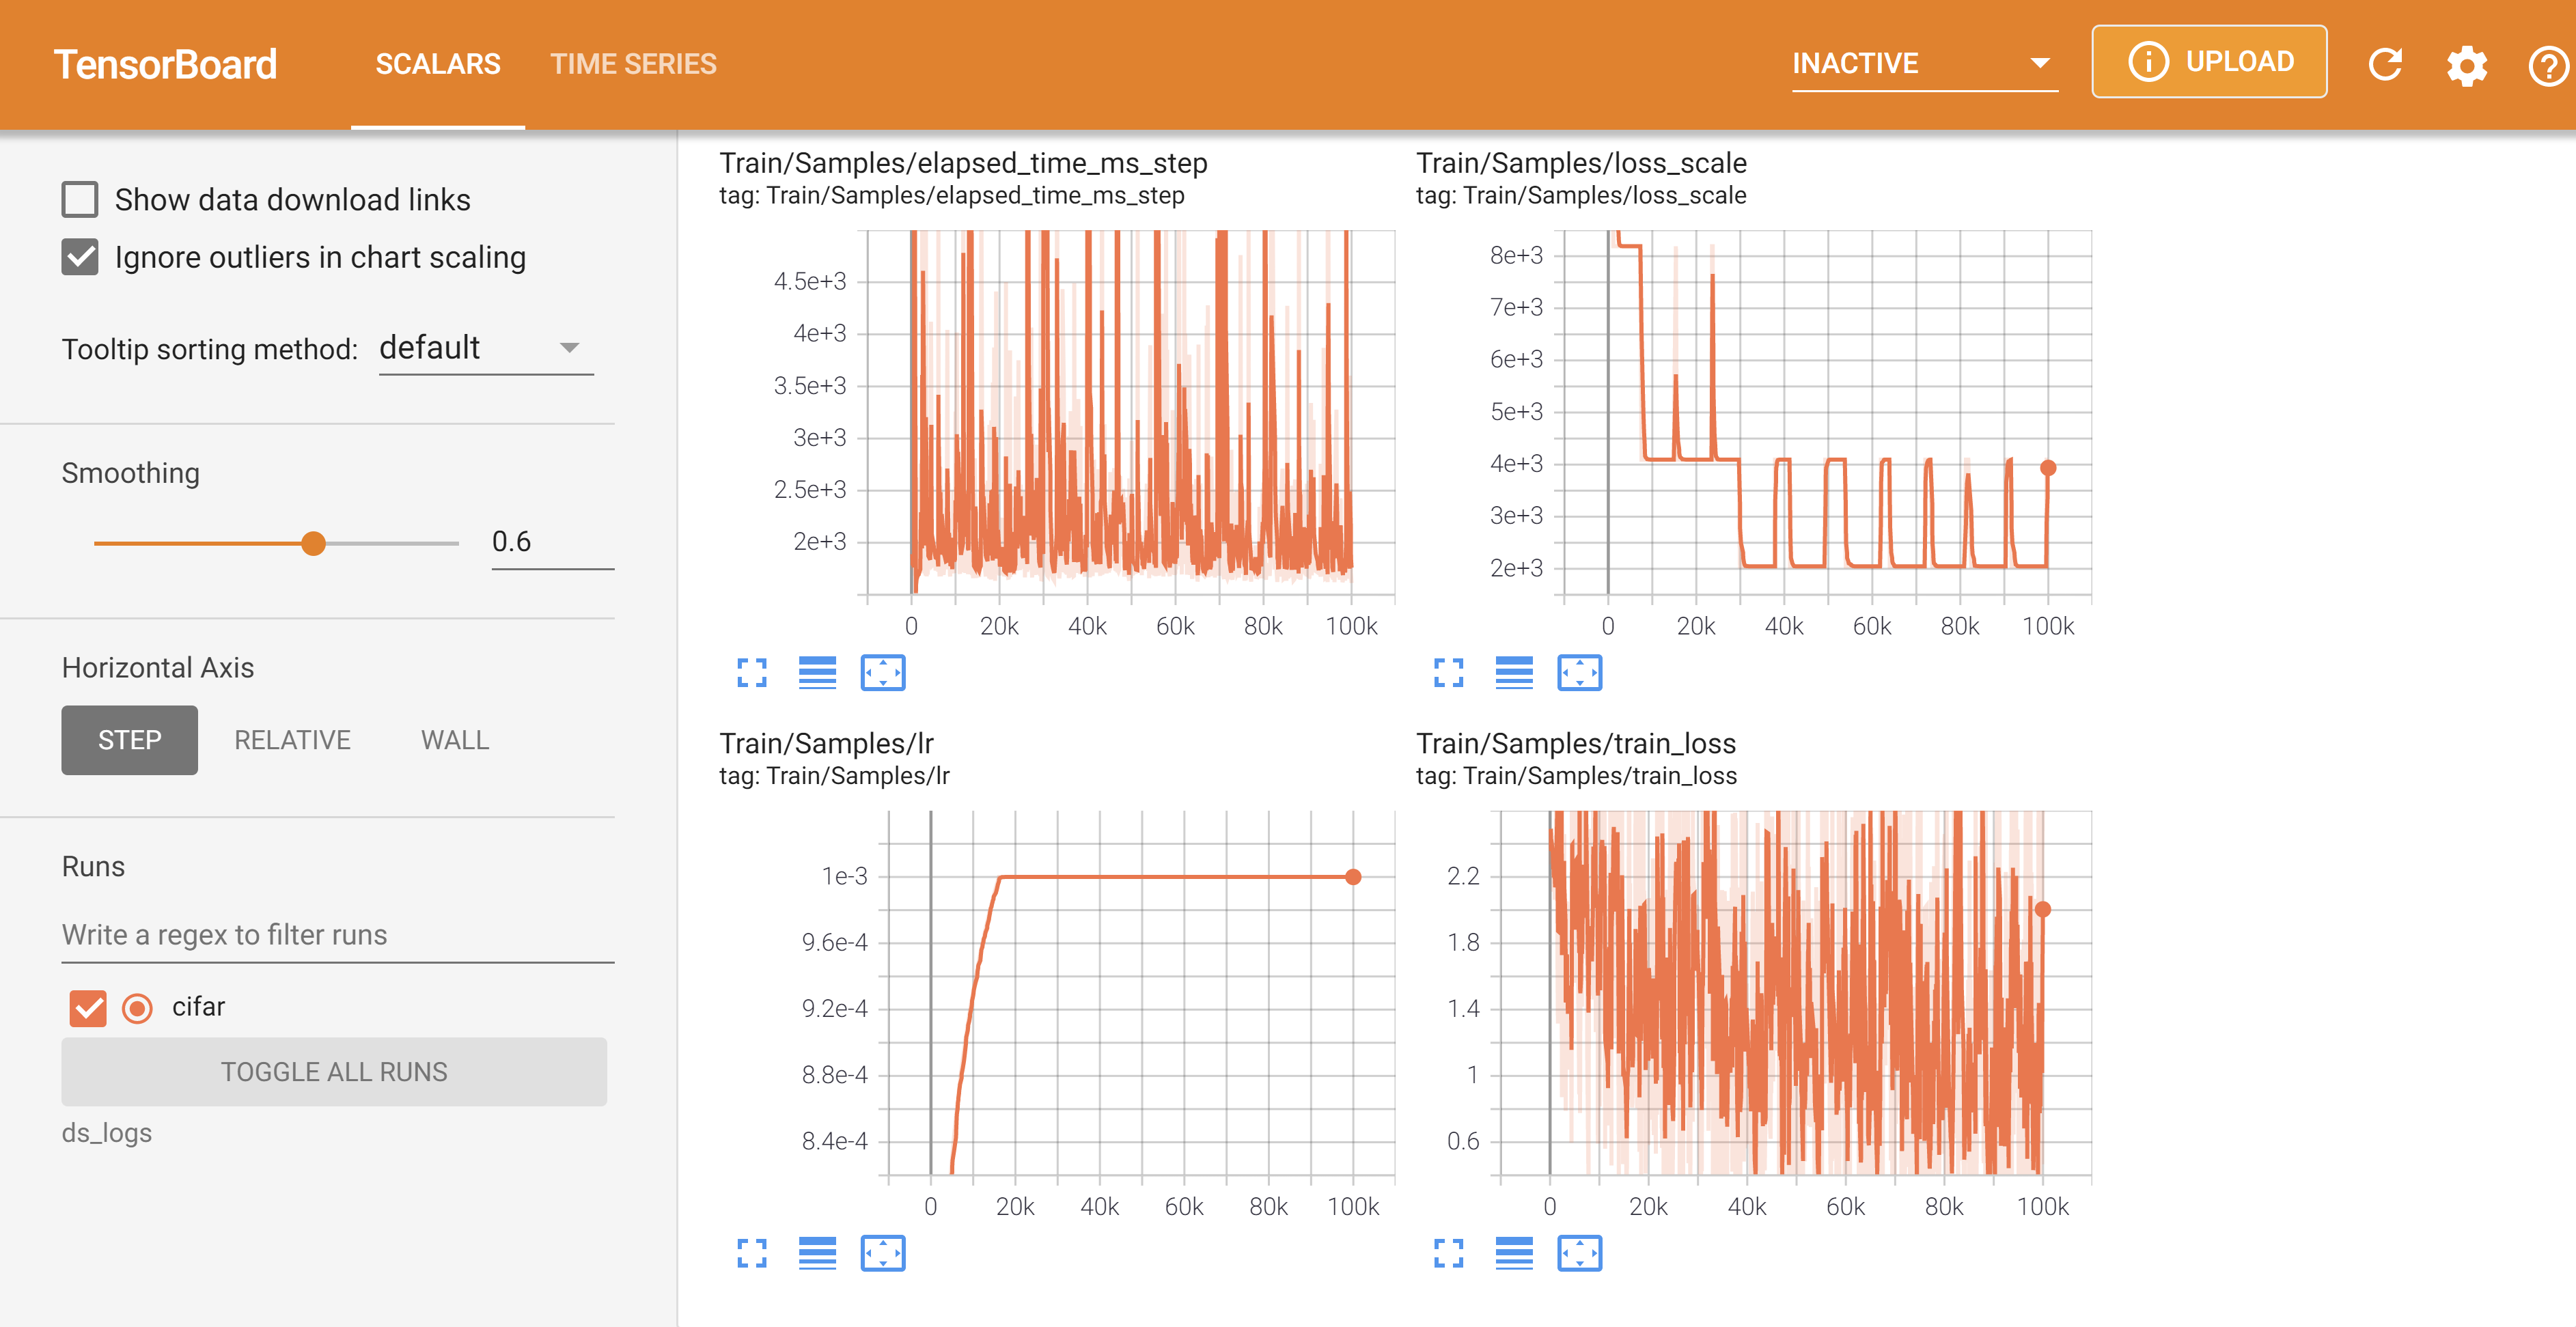
Below is a live monitoring view for TensorBoard:
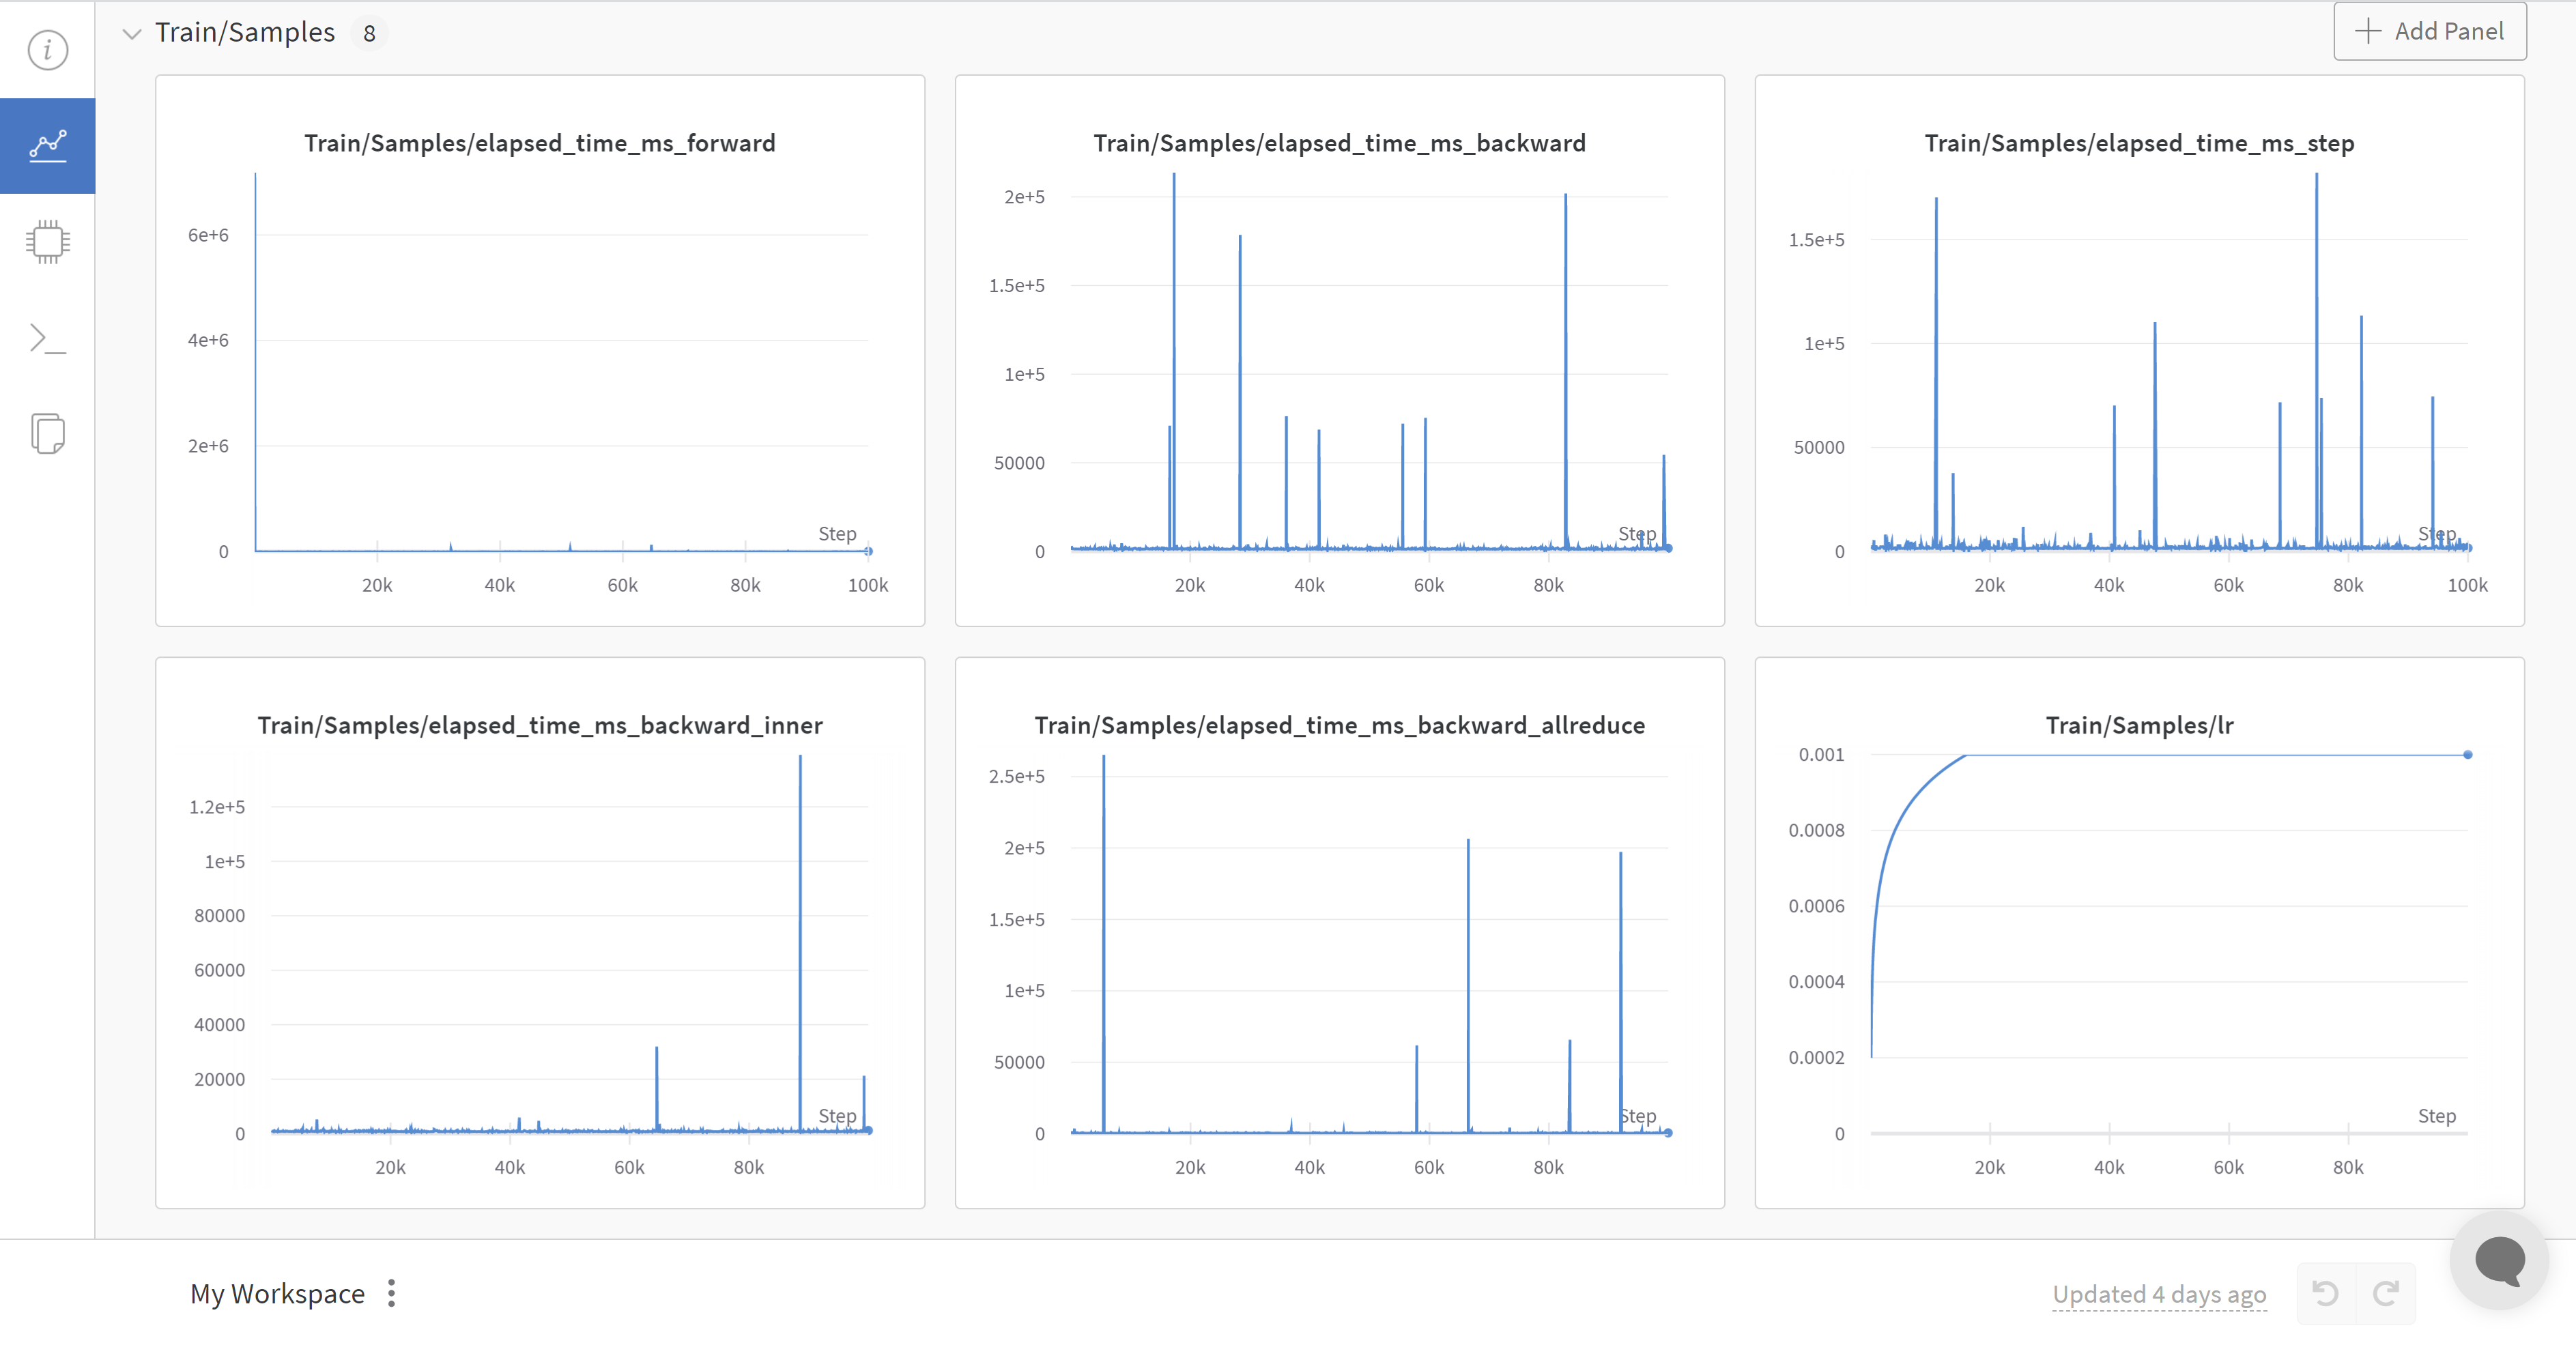
Below is a live monitoring view for WandB:
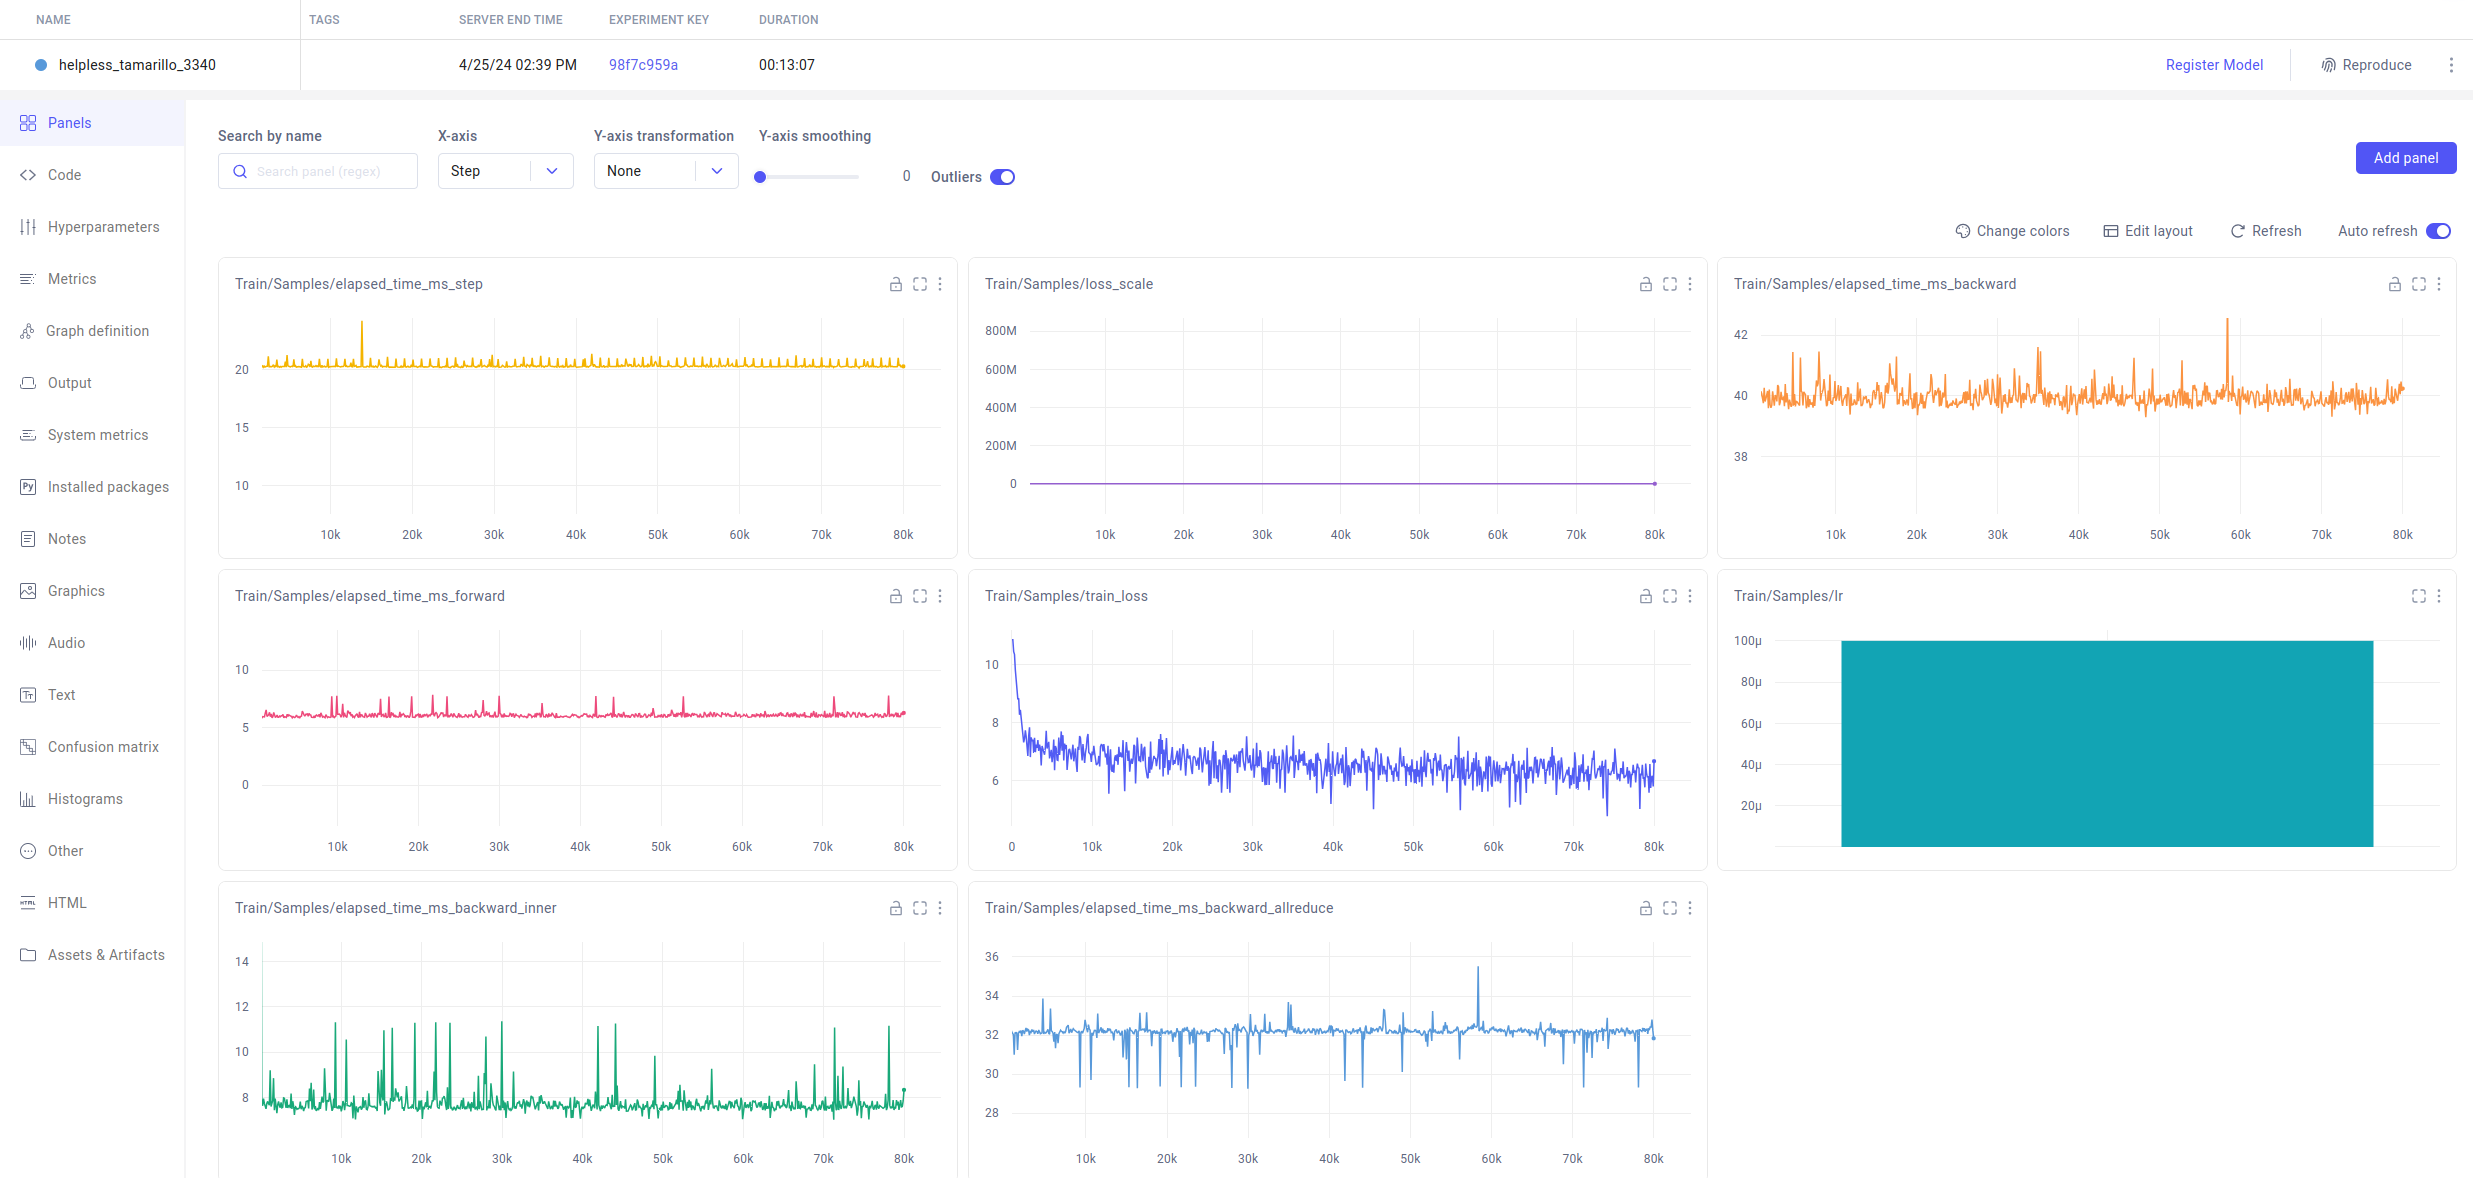
Below is a live monitoring view for Comet:
Usage
The DeepSpeed Monitor is configured within the deepspeed configuration file. DeepSpeed will automatically monitor key training metrics, including those tracked with the wall_clock_breakdown configuration option. In addition, users can log their own custom events and metrics.
Automatic Monitoring
When using DeepSpeed for model training, the Monitor can be configured in the DeepSpeed configuration file. No explicit API calls are needed to use the Monitor. The Monitor can be enabled by adding the following field to DeepSpeed’s configuration json file. Refer to Monitoring for details.
{
  "tensorboard": {
    "enabled": true,
    "output_path": "output/ds_logs/",
    "job_name": "train_bert"
  }
  "wandb": {
    "enabled": true,
    "team": "my_team",
    "group": "my_group",
    "project": "my_project"
  }
  "comet": {
    "enabled": true,
    "project": "my_project",
    "experiment_name": "my_experiment"
  }
  "csv_monitor": {
    "enabled": true,
    "output_path": "output/ds_logs/",
    "job_name": "train_bert"
  }
}
DeepSpeed will automatically log to all available and enabled monitoring backends listed in the config, and will generate live monitoring views such as those listed above.
Custom Monitoring
In addition to automatic monitoring, users can log their own custom metrics in client scripts. Currently, there are two ways to initialize Monitor objects:
- (Recommended) - Create a
MonitorMaster(ds_config.monitor_config)object, which automatically initializes all monitor backends present in the DeepSpeed configuration - Create a specific
TensorBoardMonitor(ds_config.monitor_config),WandbMonitor(ds_config.monitor_config),csvMonitor(ds_config.monitor_config)object which will only initialize a specific monitor backend present in the DeepSpeed configuration
The steps to create a custom monitor are as follows:
- Add import to your desired Monitor
- Initialize monitor with DeepSpeed config’s
monitor_config - Create a list of one or more 3-tuples in the format
[("label", value, ds_engine.global_samples), ...]* - Call
monitor.write_eventson the list from step 3
* Note - Some Monitor backends don’t support mixed sample values. Be sure to use your DeepSpeed engine object’s global_samples attribute in each 3-tuple
For example usage, see the following modified DeepSpeedExamples/cifar example:
# Step 1: Import monitor (and DeepSpeed config, if needed)
from deepspeed.monitor.monitor import MonitorMaster
from deepspeed.runtime.config import DeepSpeedConfig

# Step 2: Initialized monitor with DeepSpeed config (get DeepSpeed config object, if needed)
ds_config = DeepSpeedConfig("ds_config.json")
monitor = MonitorMaster(ds_config.monitor_config)

for epoch in range(2):

    running_loss = 0.0
    for i, data in enumerate(trainloader):
        pre = time.time()
        inputs, labels = data[0].to(model_engine.local_rank), data[1].to(
            model_engine.local_rank)
        if fp16:
            inputs = inputs.half()
        outputs = model_engine(inputs)
        loss = criterion(outputs, labels)

        model_engine.backward(loss)
        model_engine.step()
        post = time.time()
        # Step 3: Create list of 3-tuple records (single entry in this case)
        events = [("Time per step", post-pre, model_engine.global_samples)]
        # Step 4: Call monitor.write_events on the list from step 3
        monitor.write_events(events)